Custom Reports in Xola provide a powerful and flexible way to build reports that meet your unique business needs. Whether you want to track bookings, analyze guest demographics, review sales channels, or monitor operational trends, these reports give you unmatched control and granularity.
Start with a pre-built report template, then customize it by selecting the exact columns you want to display—from financial details like payment method and gross/net sales, to operational data like experience type, guide assignment, or customer location. Use robust filters to zero in on any segment of your data: filter by date, product, channel, demographics, tags, staff, or even custom questionnaire responses. This flexibility means you can create focused views, such as all unpaid reservations for a specific product, or a summary of abandoned carts by marketing source.
Once your report is customized to your preferences, you can save it within the system for future use. You also have the ability to export your report to Excel or CSV files for further analysis or sharing outside Xola. For hands-off insights, schedule your custom report to be automatically delivered to your inbox daily, weekly, or monthly—ensuring key metrics reach your team and stakeholders on time, every time. With Custom Reports, you own your business intelligence, transforming data into actionable insights that drive smart decisions and continuous growth.
User Access: Administrator or Accountant roles have access to the Custom Reports in Xola.
To grant access to users, click here.
What’s Covered in This Article:
How to Access the Report
- Go to Reports > Custom Reports.
-
Choose from these templates:
- Customize Your Report:
- Columns: Use the Columns dropdown to select which data appears in your table.
- Filters: Click on the
 next to the item in the table to filter the column.
- Date filters: View past or upcoming data by selecting a date range.
- You can filter date on the top or on the different date columns in the table.
- Text filters: Choose or search for specific text values.
- Number filters: Apply logic like “greater than 100” to refine numeric data.
- Date filters: View past or upcoming data by selecting a date range.
- Export and Save:
- Export your data to Excel or CSV file.
- Click Save to save your custom report.
- Click Save As to make a new version of an existing report.
Types of Custom Reports
Transactions Report
-
What you’ll learn: Complete financial records for all transactions.
- Date Filters:
-
Transaction Date: The date when the payment or refund was actually processed.
-
Realized Date: The date when the experience took place or is scheduled to occur.
-
-
What you’ll see in the table: (* column can be filtered)
-
Transaction ID: A unique identifier for the individual transaction.
-
Transaction Date: The date when the transaction (payment or refund) was processed. *
-
Realized Date: The date when the experience occurred or is scheduled to occur. *
-
Arrival Date: The date the customer is expected to arrive for the experience.
-
Product: The name of the experience purchased
-
Customer Name: The full name of the customer who made the purchase.
-
Currency: The currency in which the transaction was processed.
-
Gross: The total amount charged before any fees or deductions. *
-
Processing Fee: The fee charged for payment processing (e.g., credit card fees). *
-
Guest Fee: The Xola service fee paid, if applicable.
-
Net: The amount received after deducting fees from the gross. *
-
Balance: The running total of your Xola balance after each transaction. *
-
Source: The booking channel or source (e.g., checkout, back office, Kiosk).*
-
Method: The payment method used (e.g., credit card, cash, POS). *
-
CC Brand: The brand of credit card used (e.g., Visa, Mastercard). *
-
Purchase ID: A unique identifier for the full purchase (may include multiple transactions). *
-
Confirmation ID: The booking confirmation number shared with the customer.
-
Taxes & Fees Total: The combined total of all taxes and fees applied to the purchase.
-
Tags: Custom or automated tags
- Payout Date: The date on which the transaction was paid out.
-
-
When to use this report: Use this for reconciliation, accounting, or to review refund activity and payment types.

Purchases Report
-
What you’ll learn: Get a clear summary of each purchase, including who reserved, what was reserved, and how much was paid or still owed.
- Date Filters:
- Created Date: The date when the purchase was made.
-
What you’ll see in the table: (* column can be filtered)
-
Purchase ID: A unique identifier for the full purchase (may include multiple transactions).
-
Created Date: The date when the purchase was made. *
-
Customer Name: The full name of the customer who made the purchase.
-
Customer Email
-
Total Value: Full reservation value before fees, discounts, or taxes *
-
Balance: The amount he customer still owes. *
-
Arrival Date: The date the customer is expected to arrive for the experience.*
-
Arrival Time: The time the customer is expected to arrive for the experience.
-
Experience Name: The name of the experience purchased *
-
Amount Paid: The amount the customer paid, including all taxes and fees.
-
Created By: Who made the reservation. If the customer reserved online, their name will show.*
-
Tags: Custom or auto-applied tags *
-
-
When to Use This Report: Use this to track new purchases, upcoming arrivals, and unpaid balances across experiences.

Reservations Report
-
What you’ll learn: A line-by-line breakdown of reservations, including fees, taxes, and guest types.
- Date Filters:
-
Booking Date: The date when the booking was made.
-
Arrival Date: The date when the experience took place or is scheduled to occur.
-
-
What you’ll see in the table: (* column can be filtered)
- Reservation ID: A unique identifier for the reservation.
- Purchase ID: A unique identifier for the purchase
-
Product: Name of experience reserved *
- Booking Date: The date when the booking was made. *
-
Arrival Date: The date the customer is expected to arrive for the experience.*
-
Arrival Time: The time the customer is expected to arrive for the experience.*
-
Customer Name: The full name of the customer who made the purchase. *
-
Customer Email *
-
Total Booked: total amount of demographics booked *
-
Followed by a breakdown of each demographic (e.g., Adults, children, etc.)
-
-
Total Check-ins: How many times the guest checked in
-
Base Amount: The original price of the experience before any taxes, fees, discounts, or add-ons are applied.*
-
Revenue: Net income after adjustments, discounts, and fees
- Payment Status: Paid, unpaid, or balance due
-
Total Value: Full reservation value before fees, discounts, or taxes *
-
Total Taxes & Fees: Full breakdown per booking
- Followed by a breakdown of each Tax and Fee
-
Add-ons Total: Additional addons selected
-
Followed by a breakdown of each add-on
-
- Coupon Campaign: Name of the coupon campaign applied *
-
Coupon Code: Code applied *
-
Coupon Amount: discount amount applied
-
Partner Name: Name of the Partner or Agent *
-
Partner Discount: Discount amount of the Partner or Agent when their code is applied
-
Partner Commission: Commission amount of the Partner or Agent when their code is applied
-
Adjustments: Other adjustments made to the reservation
-
Source: Where the reservation was made (e.g., website, back office) *
-
Status: Reservation status (confirmed, canceled, pending) *
- Guest Status: Check-in status or no-show *
- Created By: Who made the reservation. If the customer reserved online, their name will show.
- Confirmation Code: Code provided to the customer via email
- Tags: Custom or automated tags
-
When to use this report: Use this when you need granular reservation data for accounting, operational forecasting, or guest demographic reporting.

Abandoned Reservations Report
-
What you’ll learn: See which reservations were started but not completed, and which were later recovered via Abandoned Reservation Recovery.
- Date Filters:
-
Abandon Date: The date when the checkout was abandoned
-
-
What you’ll see in the table:(* column can be filtered)
-
Reservation ID: A unique identifier for the reservation.
-
Purchase ID: A unique identifier for the purchase
- Product: Name of experience reserved *
- Booking Date: The date when the booking was made. *
- Abandoned Date: The date the checkout was abandoned. *
- Emailed Date: The date the abandoned reservation email was sent to the customer. *
- Conversion Date: The date the customer completed the purchase after abandoning it. *
-
Arrival Date: The date the customer is expected to arrive for the experience.*
-
Arrival Time: The time the customer is expected to arrive for the experience.*
-
Customer Name: The full name of the customer who made the purchase. *
-
Customer Email *
- Phone
- Status: Where the reservation is in the abandoned reservation workflow (e.g., emailed, converted)
- Total Booked: total amount of demographics booked *
-
Followed by a breakdown of each demographic (e.g., Adults, children, etc.)
-
- Total Value: Full reservation value before fees, discounts, or taxes *
-
-
When to use this report: Use this to track potential lost revenue from cart abandonment, understand booking behavior, and measure the effectiveness of abandoned reservation recovery campaigns.

Reservations by Listing Report
-
What you’ll learn: See a summary of total booking activity per experience, including guest counts, base pricing, add-ons, and taxes/fees—all grouped by product.
- Date Filters:
-
Booking Date: The date when the booking was made.
-
Arrival Date: The date when the experience took place or is scheduled to occur.
-
-
What you’ll see in the table: (* column can be filtered)
- One row per listing with totals for purchases. Does not include refunds or discounts.
- Product: Name of experience reserved
- Total Value: Full reservation value before fees, discounts, or taxes
- Total Booked: total amount of demographics booked
-
Followed by a breakdown of each demographic (e.g., Adults, children, etc.)
-
-
Add-ons Total: Additional addons selected
-
Followed by a breakdown of each add-on
-
-
Base Amount: The original price of the experience before any taxes, fees, discounts, or add-ons are applied. *
-
Total Taxes & Fees: Full breakdown per booking
- Followed by a breakdown of each Tax and Fee
- Partner Commission
-
When to use this report: Use this to measure performance by experiences, analyze booking volume and revenue drivers, and evaluate how add-ons and demographics contribute to total value.

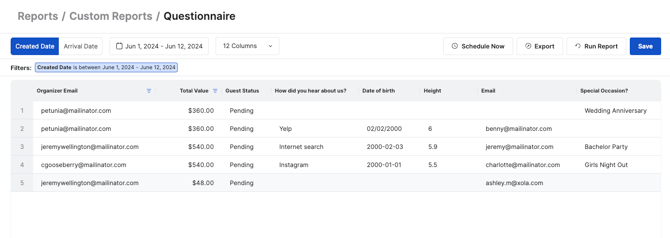
Questionnaire Report
-
What you’ll learn: View detailed reservation-level data, including booking and arrival details, customer info, guest status, and custom questionnaire responses.
- Date Filters:
- Created Date: The date when the purchase was made.
- Arrival Date: The date when the experience took place or is scheduled to occur.
-
What you’ll see in the table: (* column can be filtered)
-
Reservation ID: A unique identifier for the reservation.
-
Purchase ID: A unique identifier for the purchase
-
Product: Name of experience reserved *
- Created Date: The date when the booking was made. *
-
Arrival Date: The date the customer is expected to arrive for the experience.*
-
Arrival Time: The time the customer is expected to arrive for the experience.*
-
Organizer Name: The full name of the customer who made the purchase. *
-
Organizer Email *
-
Total Value: Full reservation value before fees, discounts, or taxes *
- Guest Status: Check-in status or no-show
- Questionnaire Questions/Answers: Each questionnaire question is in a column with your customer's answers.
- Confirmation Code: Code provided to the customer via email
- Tags: Custom or automated tags *
-
- When to use this report: Use this to track individual reservations, follow up on check-ins or no-shows, review guest data, or analyze responses to post-booking questionnaires.
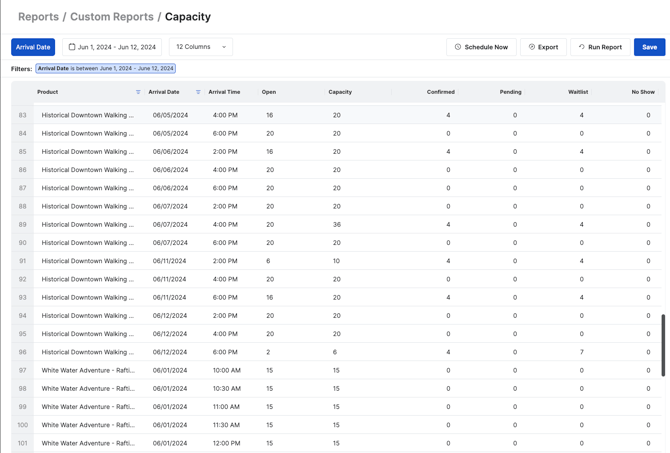
Capacity Report
-
What you’ll learn: Understand how much of your available capacity was used for each experience, including confirmed bookings, cancellations, no-shows, and other key guest status metrics.
- Date Filters:
-
Arrival Date: The date when the experience took place or is scheduled to occur.
-
-
What you’ll see in the table: (* column can be filtered)
-
Product: Name of experience reserved *
-
Arrival Date: The date the customer is expected to arrive for the experience.*
-
Arrival Time: The time the customer is expected to arrive for the experience.
-
Open: How much capacity is still available
-
Capacity: The total number of capacity that was available to be reserved
-
Confirmed: How many guests are confirmed
-
Pending: How many guests are pending
-
Waitlist: How many guests are waitlisted
-
No Show: How many guests were a no show
-
Canceled: How many guests canceled
-
Utilization%: The percentage of capacity that was filled (Guests Booked ÷ Event Capacity × 100). *
-
Contributing Factors: Reasons that may be affecting capacity, such as equipment limitations, manual adjustments, or other operational constraints.
-
- When to Use This Report: Use this to monitor capacity utilization, identify under- or overbooked events, and investigate operational factors that may be affecting availability.
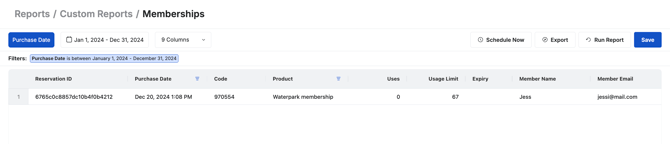
Memberships Report
Note: You'll need to have our Membership feature on to see this report.
- What You’ll Learn: See how memberships are being used, including usage counts, limits, expiration dates, and which memberships are being purchased.
- Date Filters:
-
Purchase Date: The date when the purchase was made.
-
-
What you’ll see in the table: (* column can be filtered)
-
Reservation ID: A unique identifier for the purchase
-
Purchase Date: The date when the membership was purchased. *
-
Code: The unique code tied to a member's active membership plan.
-
Product: The membership product that was purchased. *
-
Uses: The number of times the membership has been used for a reservation.
-
Usage Limit: The maximum number of times the membership can be used.
-
Expiry: The date the membership is set to expire.
-
Member Name: The full name of the customer who holds the membership.
-
Member Email: The email address associated with the membership holder.
-
- When to Use This Report: Use this to track membership activity, monitor usage against limits, and follow up with members before expiration.
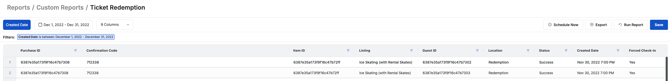
Ticket Redemption Report
Note: You'll need to turn on our Redemption and Ticketing features to see this report.
- What You’ll Learn: Track ticket usage by seeing which tickets were scanned, their status, and when they were redeemed.
- Date Filters:
-
Created Date: The date when the purchase was made.
-
-
What you’ll see in the table: (* column can be filtered)
-
Order ID: A unique identifier for the purchase that includes the ticket.*
-
Confirmation Code: The code provided to the guest to confirm their booking.
-
Item ID: A unique ID for the experience that was purchased*
-
Listing: The name of the experience or product the ticket is for.*
-
Guest ID: A unique identifier for the specific guest tied to the ticket.*
-
Location: Where the reservation was made (e.g., website, back office)*
-
Status: Indicates whether the ticket was redeemed, pending, canceled, etc.*
-
Scan Date: The date and time the ticket was scanned for check-in.*
-
Force Check-in: Shows whether the ticket was manually overridden and checked in.
-
- When to Use This Report: Use this to monitor check-ins, verify attendance, and identify any manually overridden (force-checked-in) tickets.
Schedule a Custom Report
You can automatically email yourself a report on a recurring basis after it’s saved.
To Schedule:
-
Open a saved report.
-
Select a Relative Date Range (e.g., "Last 7 Days").
-
Click Update Report.
-
Click Schedule Now.
-
Choose:
-
Frequency (daily, weekly, monthly, yearly)
-
Day and time to send
-
-
Click Save.
You’ll receive an Excel version of the report via email based on your selected schedule.
Note: Only reports with relative date ranges can be scheduled. If you use specific calendar dates, you’ll receive the same data each time.
