With Xola’s Net Promoter Score (NPS) feature, you can seamlessly gather guest feedback at key moments in the customer journey. Xola sends an automated NPS survey via email and/or text message, allowing you to collect valuable insights from guests while their experience is still fresh. If your reservation includes multiple guests with valid email addresses or phone numbers, you can choose to send the survey to every attendee, not just the organizer.
Flexible survey settings let you decide when the NPS request is delivered - immediately after checkout, a set number of hours after the event, or at whatever time makes sense for your operation. Each guest receives a clear, branded survey asking for their likelihood to recommend your business, and can also leave personalized comments based on their score.
All submitted scores, comments, and guest data are automatically tracked, organized, and available for you in Xola’s robust Net Promoter Score Reports. Filter and segment feedback by experience, date, guide, or guest demographic to uncover trends and areas for improvement. These insights empower you to take action, elevate the guest experience, and foster more promoters for your brand.
User Access: Admin or Curator roles have access to set up NPS in Xola.
Admin roles can view NPS reporting in Xola.
To grant access to users, click here.
What's covered in this article:
How to enable NPS
- Navigate to the Xola App Store by clicking the App Store tab on the left hand side.
- Locate Net Promoter Score, and select the App Store tile.
- Click the Install button.
Configure NPS Survey settings
Once installed from the App Store, you can set up and configure the NPS Survey Settings.
- Go to Apps > Net Promoter Scores, and click on the Configure button.
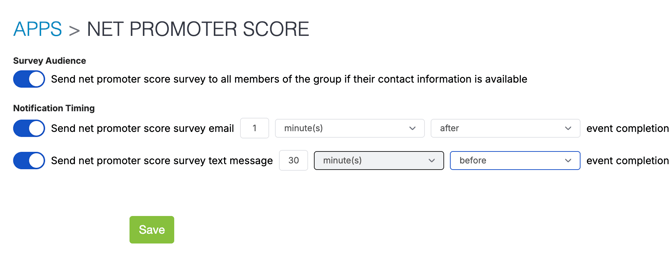
- Now, toggle on or off the following:
- Survey Audience
- Send a net promoter score survey to all members of the group if their contact information is available. This will send to all members who fill out the questionnaire or the waiver with the email, not just the organizer.
- Notification Timing
- Survey Audience
-
-
- Send net promoter score survey email: When toggled on, you can set whether the email is sent before or after the customer's event is completed, and set the timing.
- Send net promoter score survey text message: When toggled on, you can set whether the SMS is sent before or after the customer's event is completed and set the timing.
-
If you don't toggle and change the timing, the default values for sending NPS survey communication are:
- Email: 8 hours after event completion
- Text message: 30 min after event completion
- Click Save.
NPS Survey sent to Customer
This is the email sent to your customer:

- After the customer chooses a score, a new screen will appear that allows them to change the score and leave a comment.
- The message for the comment changes based on the score:
- Score 0-6 "What could we have improved?"
- Score 7-8 "What could we have done differently to WOW you?"
- Score 9-10 "What did you like most about your experience?"
- Once, the customer hits submit, they will be shown a Thank You page.
NPS Report
Now that your customers have filled out the NPS survey, you have reports to analyze their answers and other data points.
- Go to Reports > Net Promoter Score.
- You can choose which report you would like to see by clicking the tabs at the top of the report.
- At the top, you will get the following reports.
- Click on them to see the report.

Reviews Report
This report will show you all the reviews that your customers have left.
- Filter your report if needed:
- Date: The date that the NPS survey was submitted.
- Experience: The experience that the customer went on.
- Guides: The guide who was assigned to the event.
- Age
- Gender
- NPS Number: This is determined by subtracting the percentage of customers who are detractors from the percentage who are promoters, generating a score between -100 and 100.
For example, all of your customers gave a score between 0 and 6, which would lead to an NPS of -100. On the other hand, if all of your customers answered the question with a 9 or 10, then your total Net Promoter Score would be 100.
- Type of NPS Scores
- Promoters (Green): Customers who gave a score of 9 or 10 loved their experience. They are enthusiastic advocates who are likely to recommend you to others.
- Passives (Yellow): Customers who gave a score between 7 and 8 are somewhat satisfied. They are not dissatisfied enough to spread negative reviews of their experience, but are also unlikely to engage in promoting your experience or brand.
- Detractors (Red): Customers who gave a score between 0 and 6 were not happy about their experience. These customers are a brand liability in that they could damage your reputation by leaving a public negative review about the company.
- You will see the following in the results:
- The customer's individual NPS Score:
- Green: Promoter
- Yellow: Passive
- Red: Detractor
- Date and Time the customer left the review
- Name of the Customer
- The Experience
- Email Address and Phone Number of the customer
- You can also send that individual customer an email by hitting the Message button. This will take you to the purchases page, where you can send a message.
- The customer's individual NPS Score:
Note: The results can be filtered by Promoters, Passive, and Detractor responses by toggling the toggles on and off in the results area of the report.

Overview Report
This report will show you a Monthly Average NPS and a Weekly NPS breakdown.
- Filter your report if needed:
- Date: The date that the NPS survey was submitted.
- Experience: The experience that the customer went on.
- Guides: The guide who was assigned to the event.
- Age
- Gender
- NPS Number: This is determined by subtracting the percentage of customers who are detractors from the percentage who are promoters, generating a score between -100 and 100.
For example, all of your customers gave a score between 0 and 6, which would lead to an NPS of -100. On the other hand, if all of your customers answered the question with a 9 or 10, then your total Net Promoter Score would be 100.
- Type of NPS Scores
- Promoters (Green): Customers who gave a score of 9 or 10 loved their experience. They are enthusiastic advocates who are likely to recommend you to others.
- Passives (Yellow): Customers who gave a score between 7 and 8 are somewhat satisfied. They are not dissatisfied enough to spread negative reviews of their experience, but are also unlikely to engage in promoting your experience or brand.
- Detractors (Red): Customers who gave a score between 0 and 6 were not happy about their experience. These customers are a brand liability in that they could damage your reputation by leaving a public negative review about the company.
- Monthly Average NPS: A graph of your NPS average over the month, so you can easily see how the NPS is doing month over month.
- Weekly NPS breakdown: A Bar graph for week-over-week NPS scores.

Segments Report
This report will allow you to see how your age and demographic segments are broken out in percentages by gender and product.
- Filter your report if needed:
- Date: The date that the NPS survey was submitted.
- Experience: The experience that the customer went on.
- Guides: The guide who was assigned to the event.
- Age
- Gender
- NPS Number: This is determined by subtracting the percentage of customers who are detractors from the percentage who are promoters, generating a score between -100 and 100.
For example, all of your customers gave a score between 0 and 6, which would lead to an NPS of -100. On the other hand, if all of your customers answered the question with a 9 or 10, then your total Net Promoter Score would be 100.
- Type of NPS Scores
- Promoters (Green): Customers who gave a score of 9 or 10 loved their experience. They are enthusiastic advocates who are likely to recommend you to others.
- Passives (Yellow): Customers who gave a score between 7 and 8 are somewhat satisfied. They are not dissatisfied enough to spread negative reviews of their experience, but are also unlikely to engage in promoting your experience or brand.
- Detractors (Red): Customers who gave a score between 0 and 6 were not happy about their experience. These customers are a brand liability in that they could damage your reputation by leaving a public negative review about the company.
- Age Segmentation
- Gender
- Product
- Demographic Segmentation
- Gender
- Product

Map Report
This report gives you a heat map of your customer's geolocation.
- Filter your report if needed:
- Date: The date that the NPS survey was submitted.
- Experience: The experience that the customer went on.
- Guides: The guide who was assigned to the event.
- Age
- Gender
- NPS Number: This is determined by subtracting the percentage of customers who are detractors from the percentage who are promoters, generating a score between -100 and 100.
For example, all of your customers gave a score between 0 and 6, which would lead to an NPS of -100. On the other hand, if all of your customers answered the question with a 9 or 10, then your total Net Promoter Score would be 100.
- Type of NPS Scores
- Promoters (Green): Customers who gave a score of 9 or 10 loved their experience. They are enthusiastic advocates who are likely to recommend you to others.
- Passives (Yellow): Customers who gave a score between 7 and 8 are somewhat satisfied. They are not dissatisfied enough to spread negative reviews of their experience, but are also unlikely to engage in promoting your experience or brand.
- Detractors (Red): Customers who gave a score between 0 and 6 were not happy about their experience. These customers are a brand liability in that they could damage your reputation by leaving a public negative review about the company.
